CostGraph - Launch film
Cloud savings,
made clear.
Concept, storyboard and motion design for CostGraph’s launch film, turning cloud and AI spend into a story people can follow.
The film couldn’t load. Open the video directly.
Start with the bill.
End with the answer.
Cloud spending is an abstract subject. We built the concept around a familiar moment: the bill goes up, and nobody can explain why.
The film answers that question in stages. A live-action opening gives it a human voice, then the design moves into connected data, product screens and visual explanations of where the money goes.
One idea at a time.
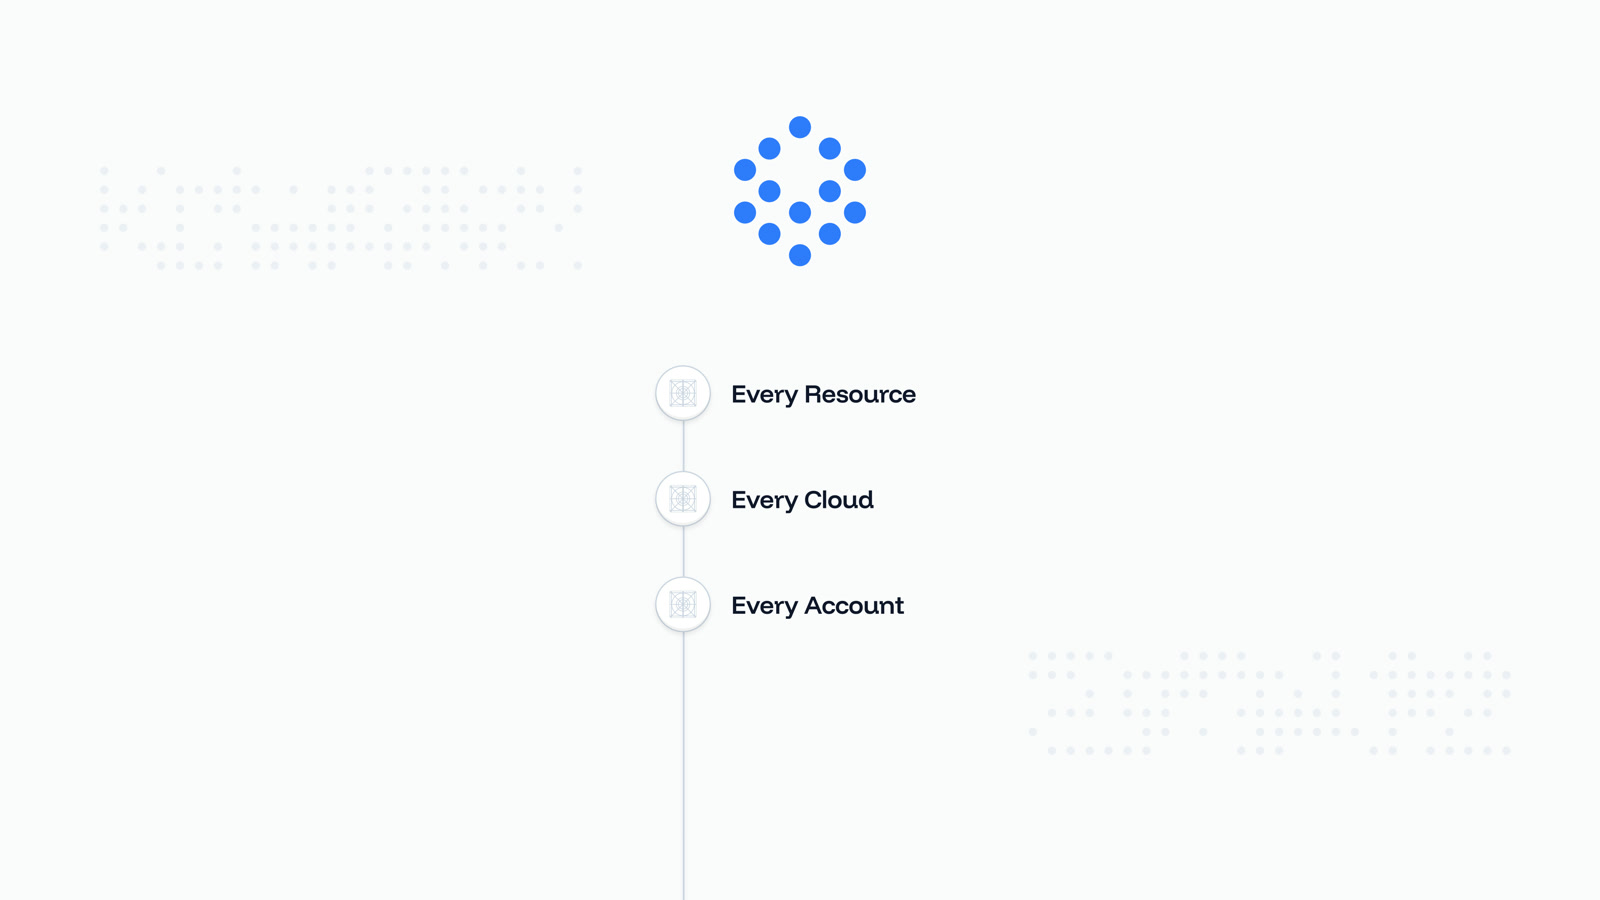
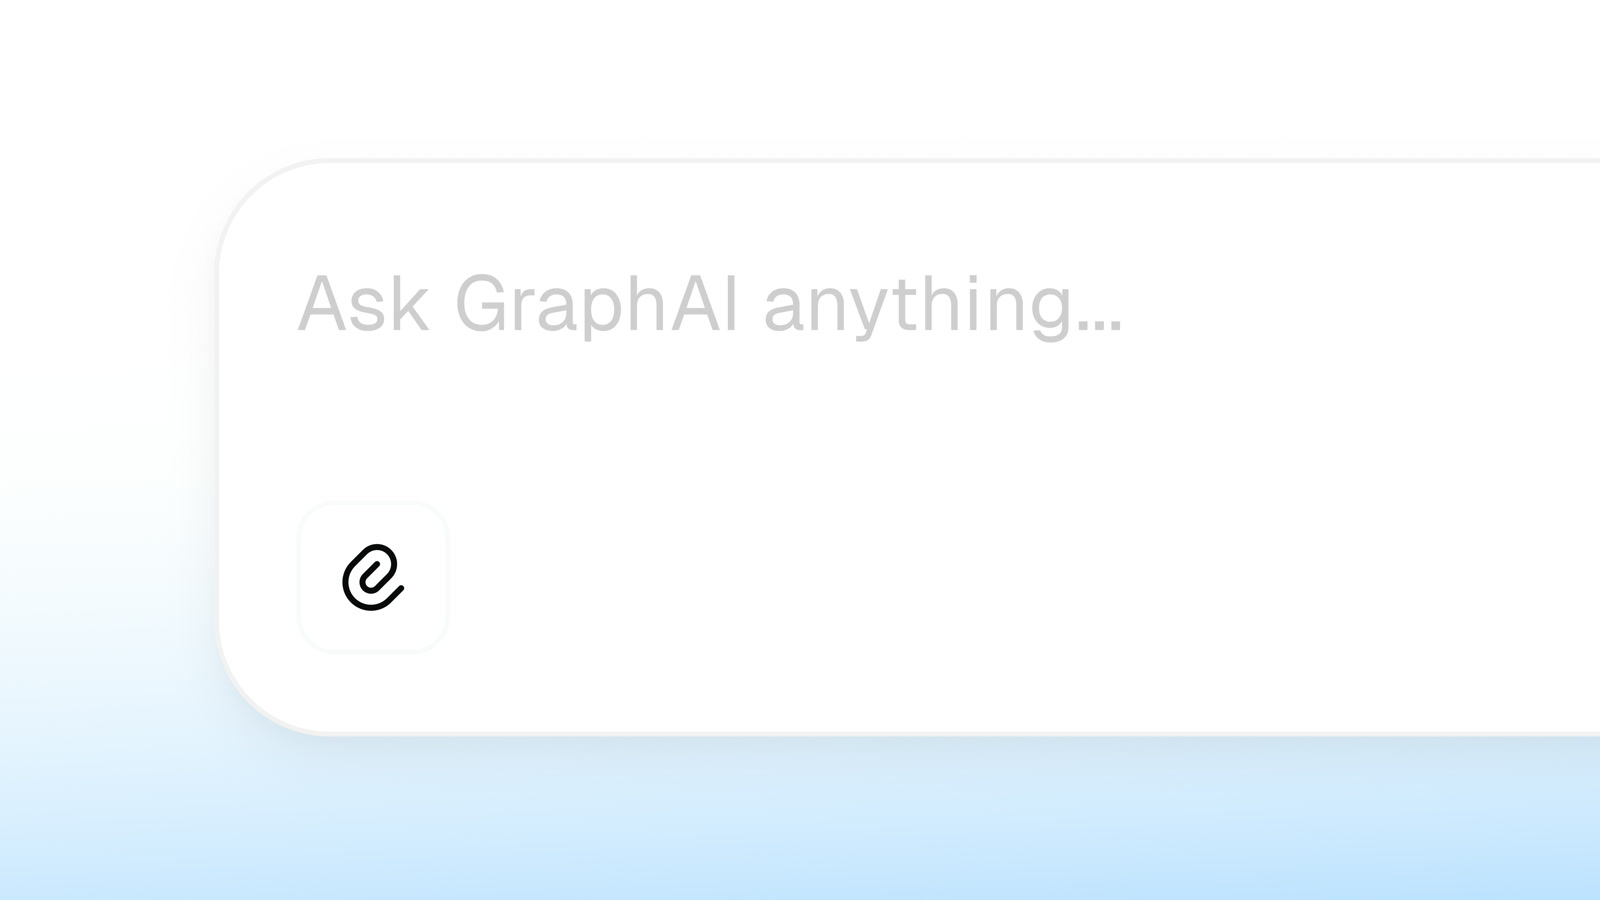
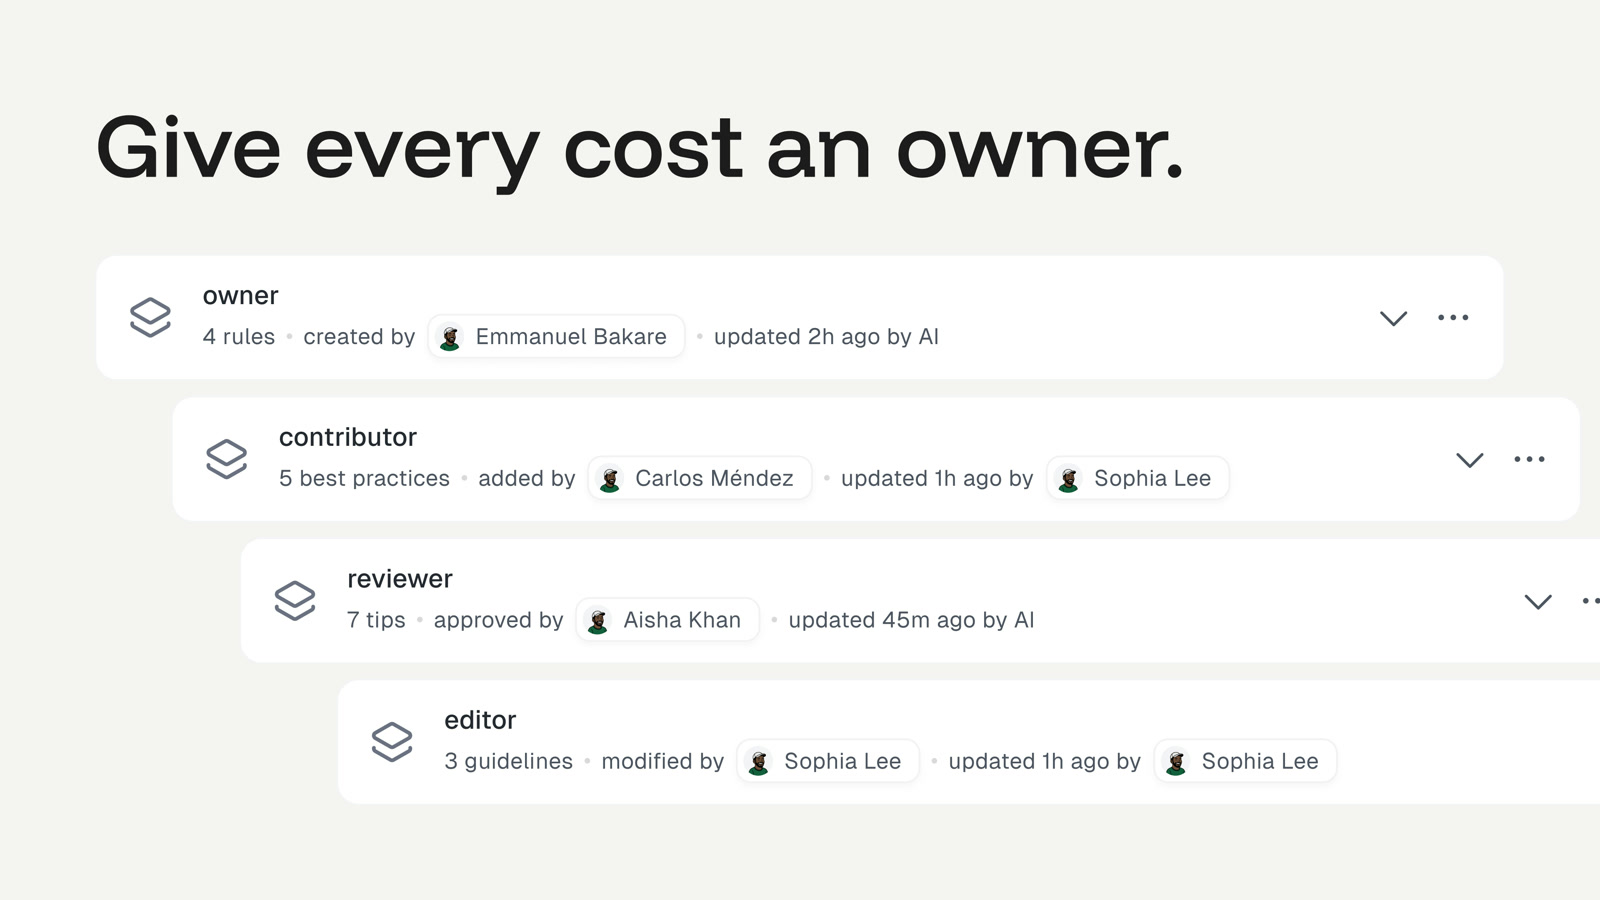
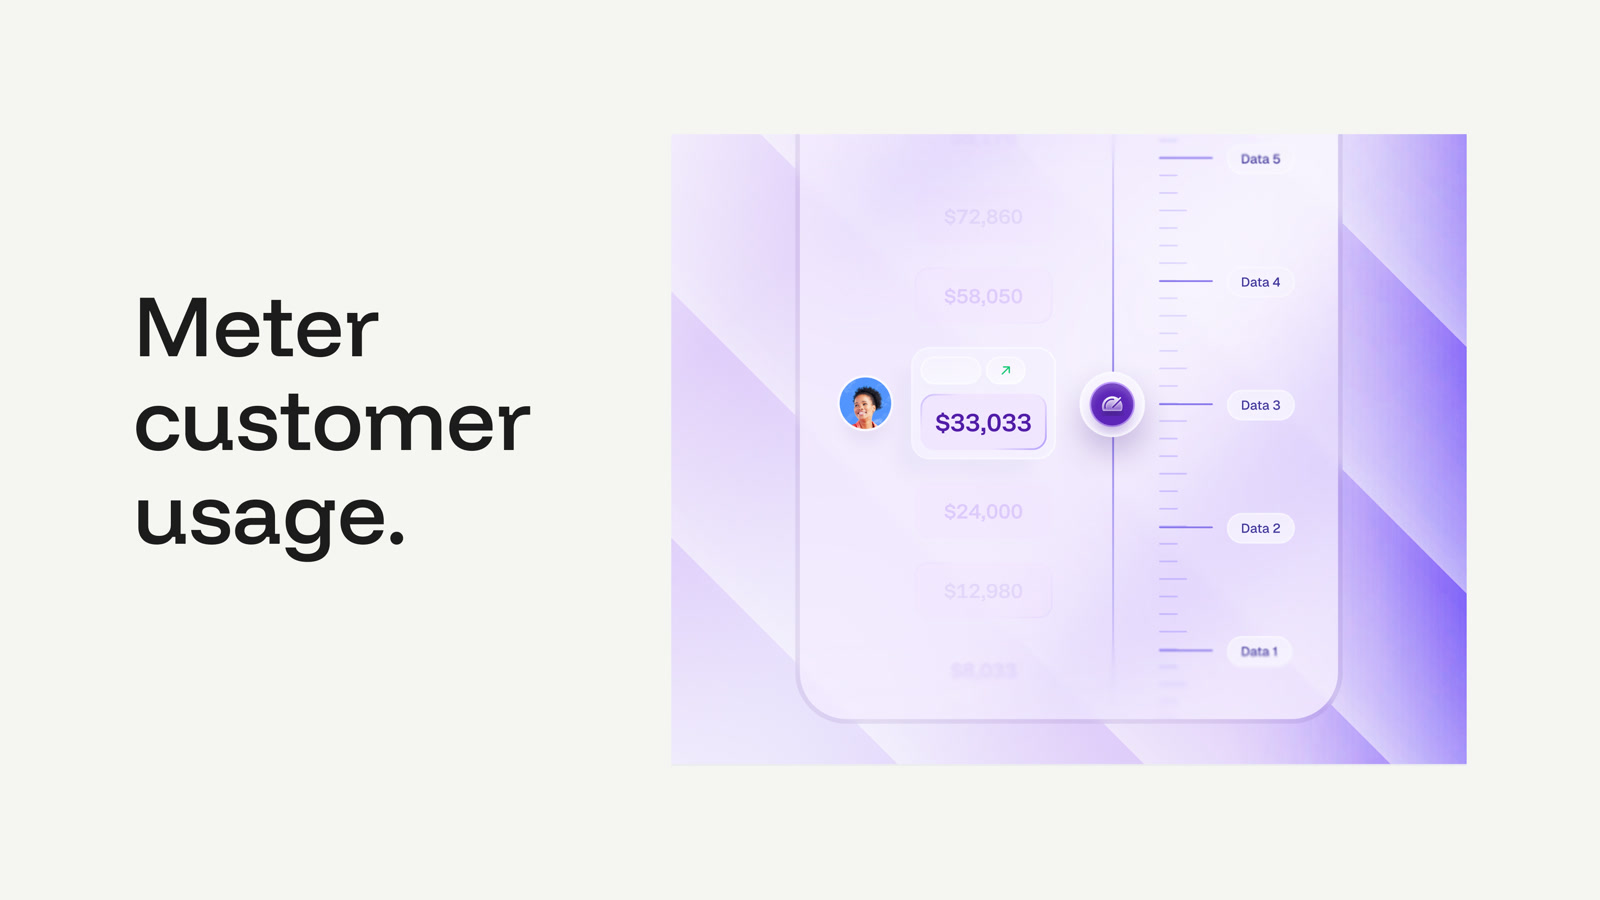
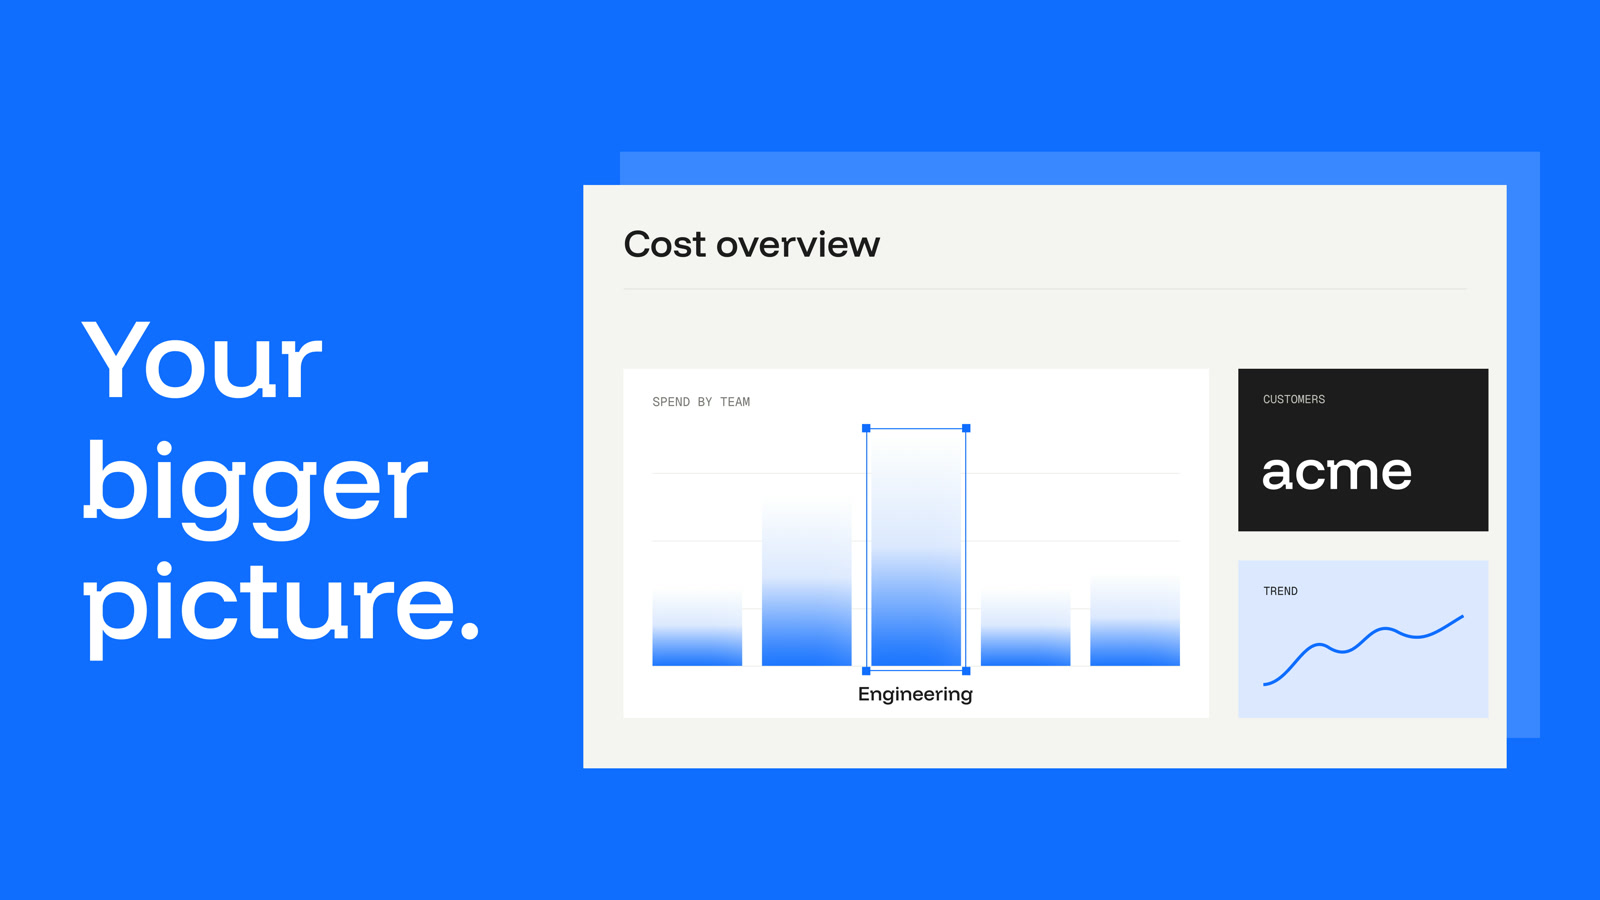
Before animation, we mapped the script into individual scenes. Integrations establish where the data comes from. Tagging gives each cost an owner. Metering makes usage tangible. Reports bring the bigger picture into view.
The boards let us work out the composition, scale and transition from one idea to the next, while keeping the product recognizable.
Make the data easy to follow.
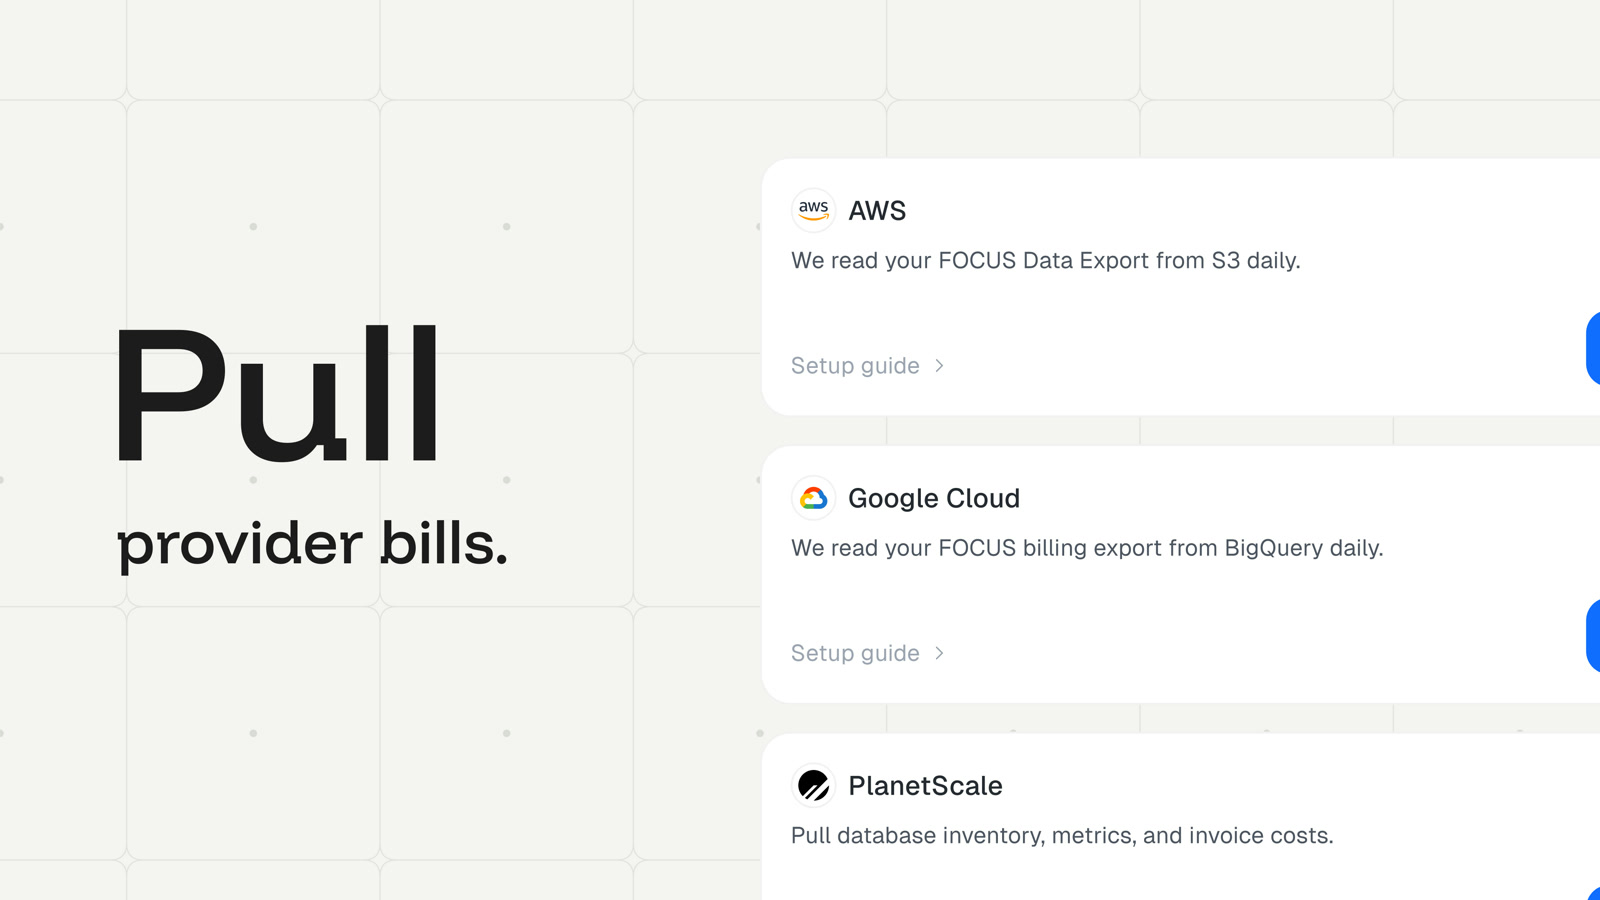
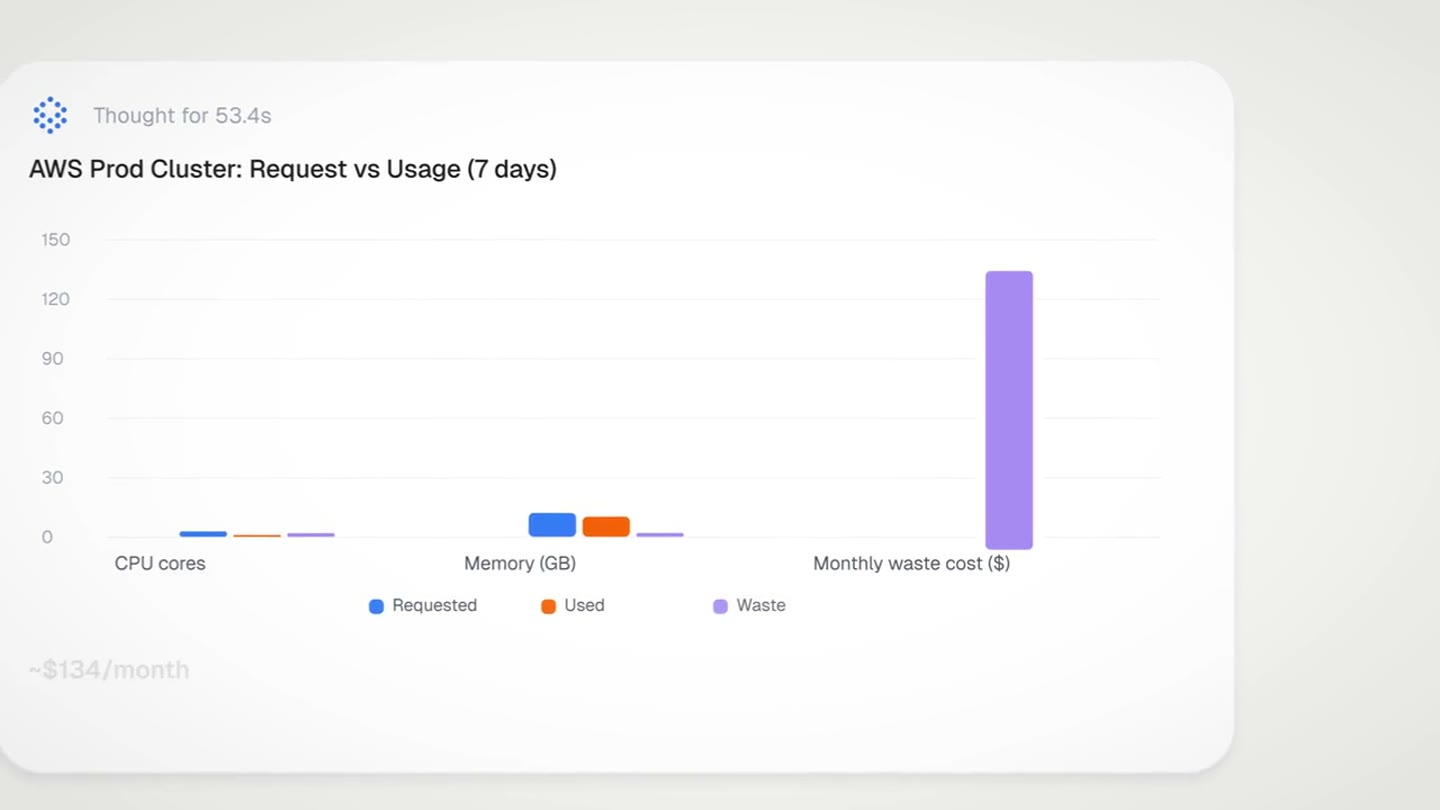
Large type introduces each idea, then the camera moves into the detail that matters: a selection, a number, a chart. Blue highlights and diagram lines connect those product moments, while the metering sequence gives usage a physical scale.
The final edit moves between those designed sequences and the presenter. Each return to the product answers another part of the question that opened the film.
A second build.
A whole new canvas.
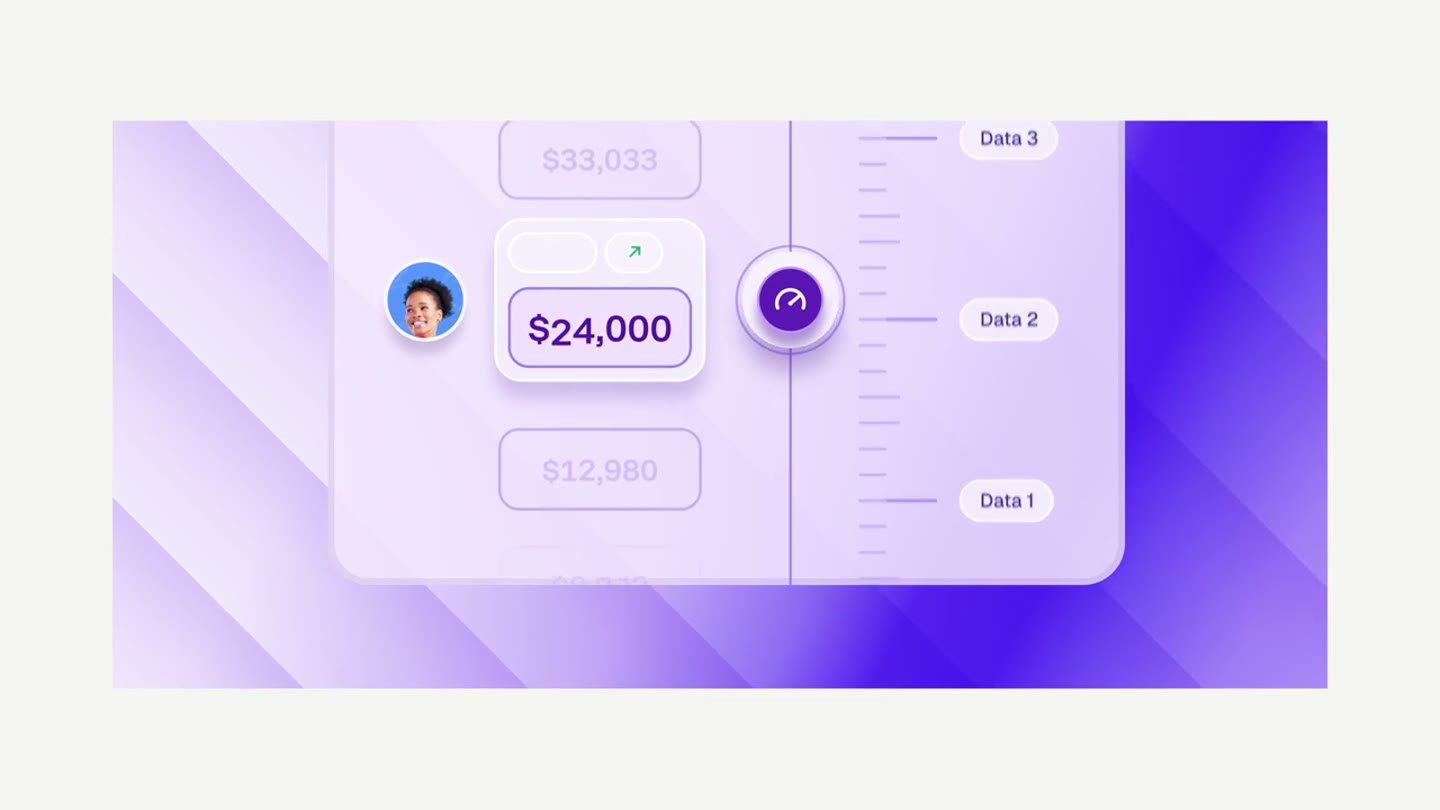
Alongside the widescreen film, we made a complete 9:16 version. The animation was rebuilt around the vertical screen, with compositions and motion designed for the taller frame.
That gave the launch its own portrait experience, with the same product story carried through a different visual rhythm.
From our work with CostGraph
“Excellent, he's worth the time and effort. Seamless delivery.”